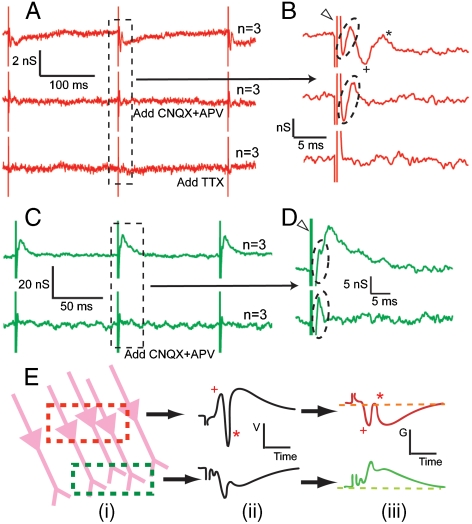
Fig. 2.
Characteristics and identification of NWFET signals. (A) Conductance vs. time traces from NWFET devices, where each trace has three stimulation events. The Top, Middle, and Bottom Curves correspond to data recorded initially, after the addition of CNQX and APV and after the addition of TTX, resp. Traces are average of three consecutive recordings (n = 3). (B) Expansion of region indicated by Dashed Frame of (A) The Open Triangle and Dashed Oval mark the stimulation and presynaptic features, resp. The Plus and Asterisk mark the postsynaptic features. (C) NWFET conductance vs. time trace recorded in a different position. The Top and Bottom Curves correspond to data recorded initially and after the addition of CNQX and APV, resp. (D) Zoom-in for region indicated by the Dashed Frame in (C). (E) Model explaining different recorded signals. From left to right: (i) Detection region overlapping with cell bodies (Red Frame) or dendrites (Green Frame); (ii) extracellular potential following stimulation exhibits opposite polarities (p-spike is marked by *, and the EPSP is marked by +) in these regions; and (iii) corresponding conductance change of p-type Si NWFET.

