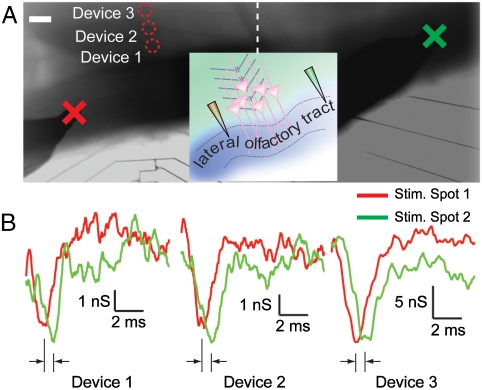
Fig. 3.
Measurement of signal propagation in LOT with 1D device array. (A) Optical image of the brain slice covering the 1D NWFET array. The 1D array is aligned perpendicularly to the LOT fiber. The Red Circles mark the positions of Devices 1–3 used for recording. The stimulation electrode is positioned at spot one (Red Cross), which is ca. 400 μm away from the array and spot two (Green Cross), which is ca. 1200 μm on the other side. The image is a composite of recorded micrographs. The Dash Line marks the border of the original pictures. The scale bar is 100 μm. Inset is a schematic of experimental configuration. (B) NWFET conductance traces from Devices 1–3 when stimulating at spot one (Red) and two (Green). Data are averaged from eight recordings.

