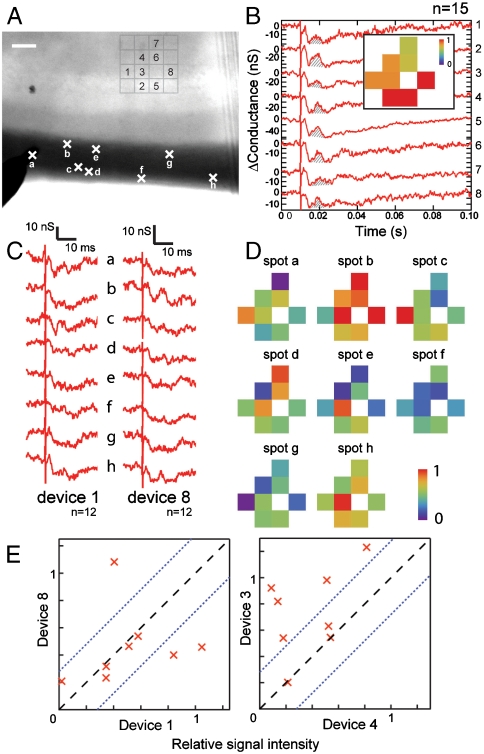
Fig. 5.
Two-dimensional mapping of heterogeneous activities in the pyramidal cell layer. (A) Optical image of an acute slice over a 4 × 4 NWFET array. Signals were recorded simultaneously from the eight devices indicated on the image. Crosses along the LOT fiber region of the slice mark the stimulation spots A–H. The stimulator insertion depth was not controlled precisely in these experiments. Scale bar represents 100 μm. (B) Signals recorded for devices 1–8 when stimulated with a 200 μs 400 μA pulse. Data are averaged from 15 recordings. The Shaded Area in each trace corresponds to the p-spike and was used to obtain normalized intensity (SI Text Methods). Inset: normalized map of the signal intensity from the 8 Devices. (C) Representative signals recorded from Devices 1 and 8 when stimulating at spots A–H with 200 μs and 100 μA pulses. Data are averaged from 12 recordings. (D) Maps of the relative signal intensity or activity for devices 1–8. (E) Correlation between Devices 1 and 8 (Upper Plot) and Devices 3 and 4 (Lower Plot) for the different stimulation positions. The Dashed Black Line marks signals that are correlated. The Dotted Blue Lines mark the uncertainty due to device signal fluctuations determined from correlation analysis (SI Text Methods).

