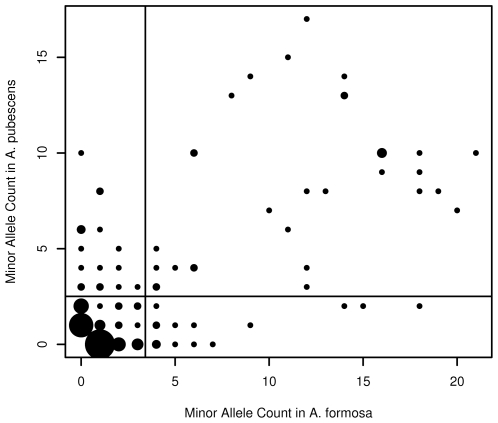
Figure 3. Comparison of minor allele counts in A. formosa and A.pubescens.
The horizontal line represents the mean allele count in A. pubescens, while the vertical line represents the mean allele count in A. formosa. Point size reflects the number of comparisons at that point. Species-specific polymorphisms correspond to the points along either the very bottom or the far left of the plot. All other sites correspond to a shared polymorphism. There are no fixed differences. The average minor allele frequency for any species-specific polymorphism was 0.105, while the average frequency for any shared allele was 0.424.

