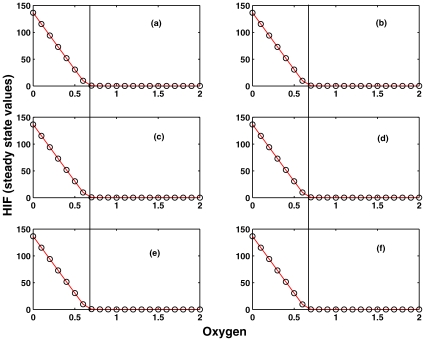
Figure 6. Experiment 1.
Comparison of the dependency of the steady state value (SSV) of HIF ( ) on the oxygen concentration by systematic silencing network parts as determined by T-invariant analysis by setting sequentially kinetic parameters to zero. (a) full model according to [16]; (b) kinetic parameters set to zero:
  ; (c)
; (c)  +(b); (d)
  +(c); (e)
  +(d); (f)
  +(e). The experiment has been done for all three parameter sets as given in [18]. The dark vertical black line indicates the critical oxygen concentration (
 0.65) for which HIF is completely degraded. It separates hypoxia (left) from normoxia (right). The SSV and the critical oxygen concentration are the same in (a)–(f). Therefore, (f) is considered as the core module for further analysis.

