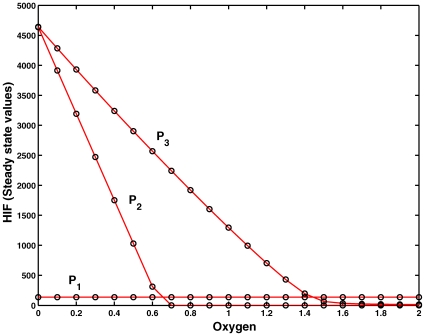
Figure 7. Experiment 2.
Contribution of the individual pathways as induced by the T-invariants  ,
,  and
and  , see Table 4, determined by numerical integration of the ODEs defined by each pathway. The efficiency of degradation of HIF by oxygen can be ordered as
  .
.  is the oxygen-independent pathway.
  degrades more efficiently due to stronger binding of PHD to HIF than ARNT.

