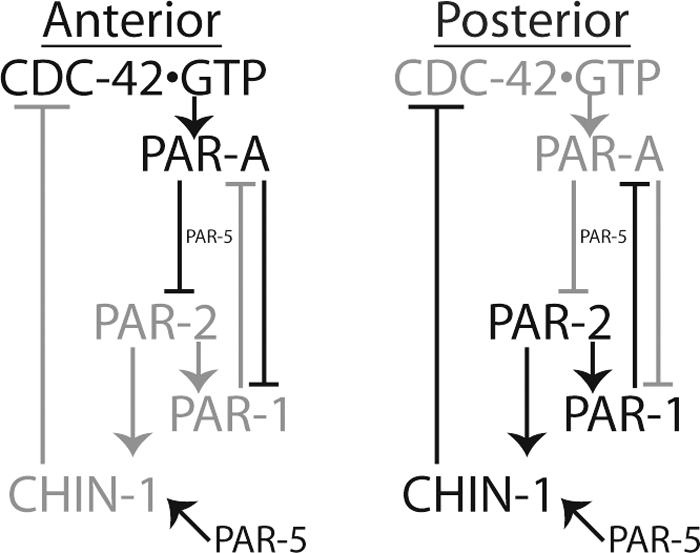
Figure 7.

Model of CDC-42activity regulation in phase II polarity maintenance. Here, regulatory associations are positive for arrows and negative for crossed lines. Gray associations are not operative, whereas dark associations are operative. For a fuller description of the model, see Discussion.
