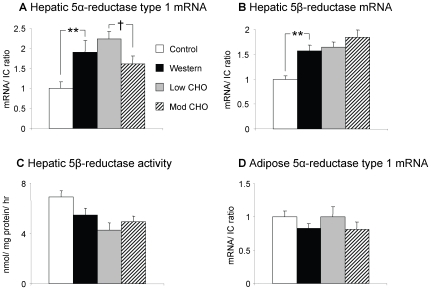
Figure 2. Hepatic and adipose tissue 5α-reductase type 1 and 5β-reductase mRNA and activity.
Data presented as mean ± SEM for lean controls (n = 11, white columns), and diet-induced obese rats after 8 weeks on Western (n = 12, black columns), low carbohydrate (low CHO) (n = 12, grey columns), and moderate carbohydrate (mod CHO) diets (n = 12, striped columns). a) Hepatic 5α-reductase mRNA. b) Hepatic 5β-reductase mRNA. c) Hepatic 5β-reductase activity. d) Peri-renal adipose tissue 5α-reductase mRNA. The mean of 18S and cyclophilin A was used as internal control (IC). mRNA transcript levels are expressed as a proportion of the mean values in controls. ** p<0.01 Western vs control. † p<0.05 mod CHO vs low CHO.

