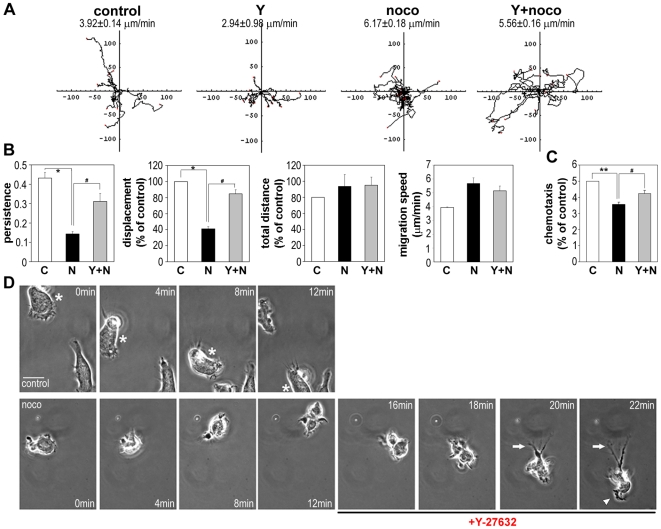
Figure 6. The effect of nocodazole on T-cell migration is rescued by Y-27632.
CCRF-CEM T cells were treated with or without 10 µM Y-27632 for 30 min and subsequently with or without 20 µM nocodazole (noco) for 10 min, then stimulated with 1 nM CXCL12 on ICAM-1-coated dishes. (A) Cell migration was monitored by time-lapse microscopy. Examples of cell trajectories of 10 to 15 cells are shown and mean migration speed ± SEM (n = 10–15). (B) Migration parameters were calculated from cell tracks. The kinetic data of 30 to 40 cells in each condition from three independent experiments are shown. *p<0.05, compared to control cells, or #p<0.05 compared to nocodazole-treated cells, indicated with bridges, Student's t-test. (C) Chemotaxis of CCRF-CEM cells towards CXCL12. Cells were pre-incubated with 10 µM Y-27632 for 30 min and/or 20 µM nocodazole for the 10 min before adding to ICAM-coated transwells. Migrated cells were counted after 60 min. **p<0.01, compared to control cells, or #p<0.05 compared to nocodazole-treated cells, indicated with bridge, ANOVA. (D) CCRF-CEM cell migration was monitored by time-lapse microscopy. Y-27632 (10 µM) was added to nocodazole-treated cells (20 µM) (noco) at 12 min (Movie S9; bottom panels). A control migrating cell is marked with an asterisk (top panels). White arrow indicates a tail induced following Y-27632 addition; white arrowhead indicates restored lamellipodium. Bar = 10 µm.

