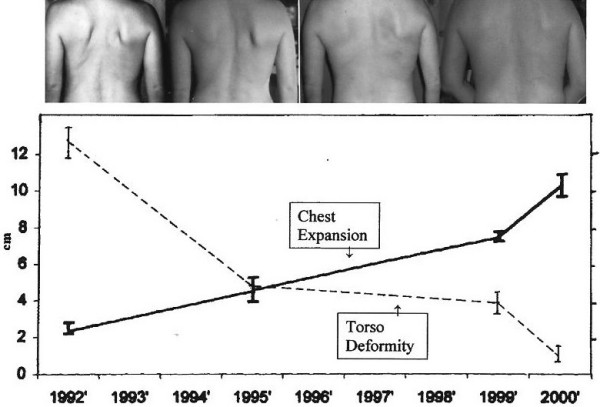
Figure 2.

Improved chest wall morphology and function. Top: Clinical aspect of the deformity documented with photography. Photos (left to right) were taken in 1991, 1995, 1999, and 2002, respectively. Bottom: Inverse relationship between increased chest expansion (solid line) and reduced torso deformity (broken line). 'Chest expansion' (cm) was measured directly based on the difference in total chest circumference at minimum and maximum inhalation [48,62]; 'torso deformity' values (cm) reflect the difference between right and left hemi-thorax, at maximum inhalation. Each value represents mean and standard deviation from at least 30 measurements taken over a 48-h period, measured at intervals between 1991 (patient age: 39 years) through 2005 (patient age: 53 years, 2.1 years post-menopause).
