
Figure 2.
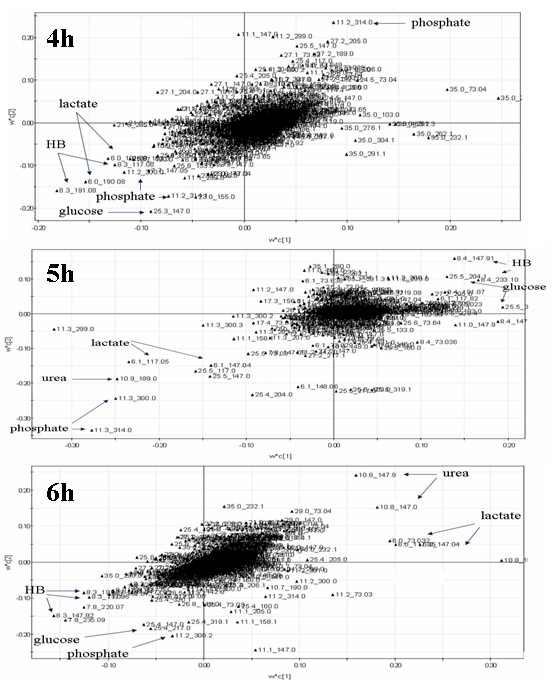
Identification of metabolic markers for distinguishing between survival and dead groups. Phosphate, HB, urea, glucose and lactate concentrations in plasma had the highest weightings on the clustering differences at 4 h, 5 h and 6 h after GalN/LPS treatment, although there was no clear cluster at 4 h.