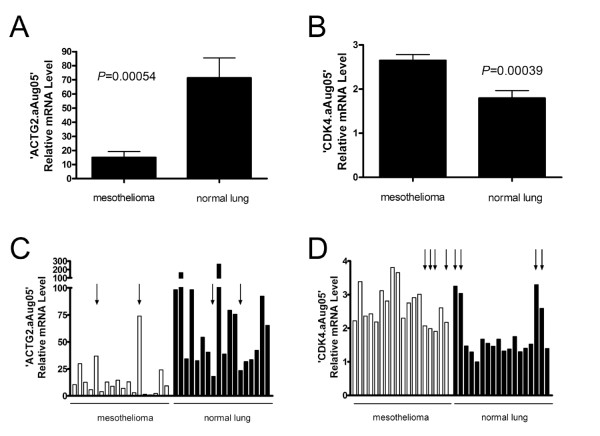
Figure 2.
Differential expression of specific exon junctions in MPM and normal lung samples. Average expression levels of exon junctions in ACTG2 (A) and CDK4 (B) differ statistically significantly between MPM and normal lung samples. Individual expression levels of exon junctions in ACTG2 (C) and CDK4 (D) can be used to classify MPM and normal tissue samples using the median value as a cut-off. Error bars, SEM. Arrows indicate misclassified samples.

