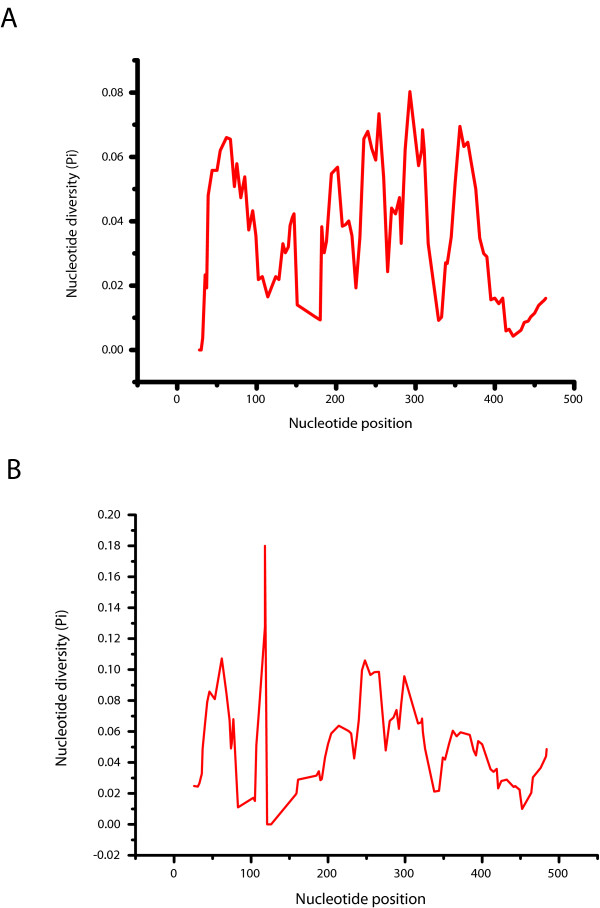
Figure 1.
Sliding window analyses of the pDo500 satellite DNA of all Dolichopoda species included in this study. The results are shown for both the consensus alignment (A) and the complete alignment (B). The graphs show the value of nucleotide diversity (π) in a sliding window size of 30 with step size 5. Each value is depicted at its mid-point.

