
Figure 4.
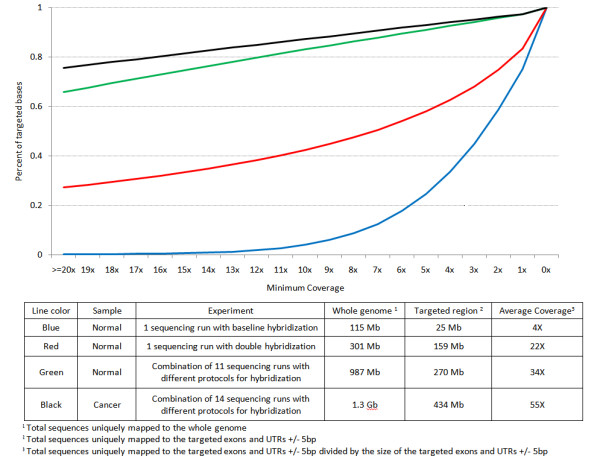
Percentage of targeted bases sequenced at various minimum coverage for different mean coverages. X-axis represents the coverage per base level and the corresponding y-axis represents the percentage of targeted bases that were covered at greater or equal with certain coverage. Table legends describe the detail of each line shown.