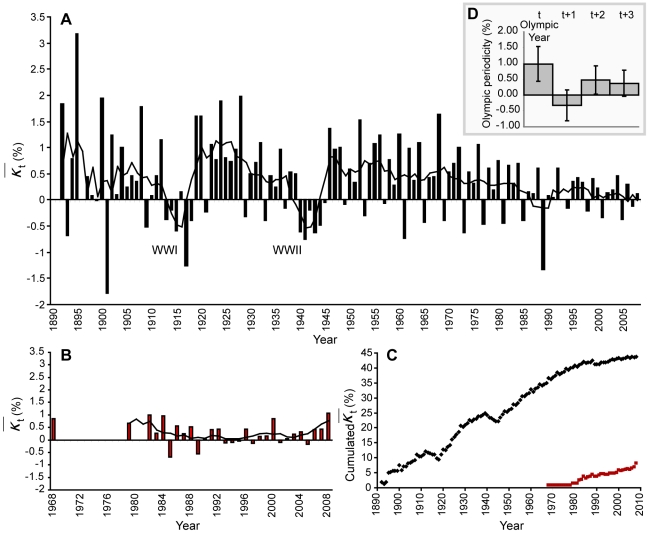
Figure 2. Evolution of performance improvement  and Olympic periodicity.
A. Evolution of  in T&F. B. Evolution of
  in swimming. C. Cumulative evolution of
  in T&F (black dots) and swimming (red squares). D. Average Olympic periodicity with standard deviation in T&F and swimming. Both
  evolutions in T&F and swimming (A, B) are given with a 4 year smoothing average (black line). After a large period of performance improvement, hindered by the two World Wars, the development of performance slow down since 1960. A larger regression is observed in 1989. At this time, random anti-doping tests were established. The impact of the Olympic games, aka Olympic periodicity reveals that performances increase by 1% during an Olympic year (t), while they regress in the following year (t+1).

