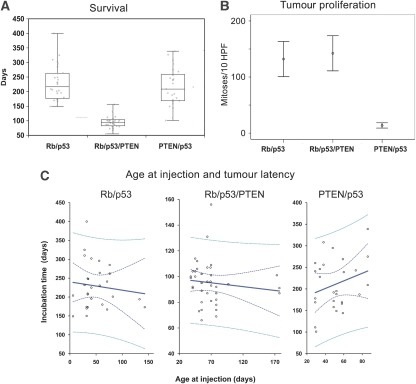
Figure 3.
(A) The genotype determines the latency of tumour formation. Mean time (days to tumour presentation±95% confidence intervals). Rb/p53/PTEN has a significantly shortened latency. P<0.05 ANOVA, post-hoc Bonferroni, box plot with 95% of all samples. All tumour types were included. (B) The genotype determines the proliferation rate of the tumours: the graph shows mean mitotic counts per 10 high-power fields (× 40 objective)±95% confidence intervals, PTEN/p53 differs significantly from the other genotypes (P<0.05 ANOVA, post-hoc Bonferroni). All tumours examined were gliomas in PTEN/p53mice and PNET in two other genotypes. (C) The tumour latency is independent of the age at injection. The graph shows the relationship between age at injection and the tumour incubation time (development of neurological signs). Polynomial regression analysis was performed. None of the genotypes showed a significant correlation between age at injection and latency. Rb/p53: r=−0.22, P=0.55; Rb/p53/PTEN: r=−0.05, P=0.38; PTEN/p53: r=0.8, P=0.17. Solid blue line, linear fit; dotted blue line, 95% confidence interval; dotted green line, 95% prediction interval. A full-colour version of this figure is available at The EMBO Journal Online.

