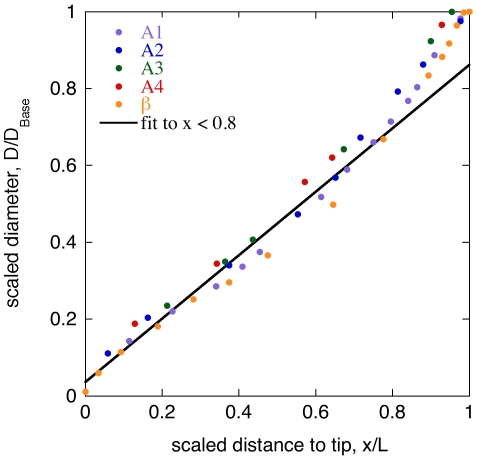
Figure 1. Whisker taper.
Profiles of five whiskers from a Wistar rat (data from [29]), with x and y scaled by total whisker length and basal diameter respectively. Labels A1 through A4 and β indicate whisker locations on the mystacial pad. Line is the best fit to all points with scaled length less than 0.8, fit equation, y = 0.036+0.825 x.

