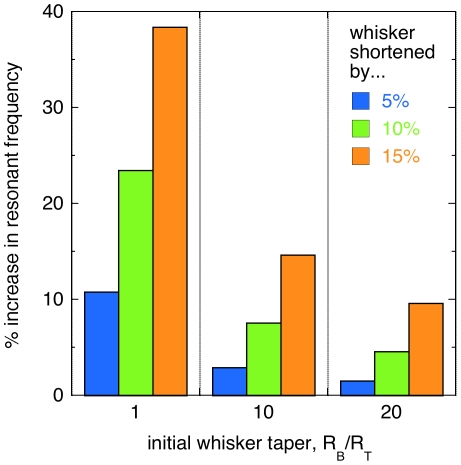
Figure 5. Resonant frequency robustness.
. Graph showing the percentage increase in the resonant frequency of a model whisker after a break that decreases the length by 5, 10, or 15%. Values are calculated using Eqns. (1) and (2), for an untapered elastic beam (R B/R T = 1) or a tapered elastic beam (R B/R T = 10 and 20).

