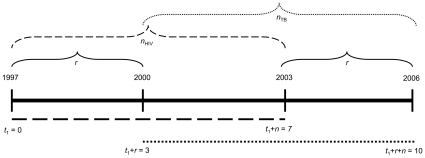
Figure 1. Timeline used to generate  values depicted in Figure 2.
The HIV time frame starts at t 1 = 0, corresponding to 1997. In order to track the impact of HIV on TB, we delay the TB time frame by r = 3 years. Accordingly, we analyze TB data starting at t 1+r = 3 years, i.e. 3 years after 1997, which corresponds to the year 2000. We have TB data until the year 2006, such that the length of our TB time frame spans 2000–2006, for a total of n = 7 years of TB data. Under our formulation this corresponds to t 1+r+n = 10. Because optimally we compare trends for the same number of years for the two diseases, we also use 7 years of HIV data, t 1+n = 7 years, i.e. from 1997–2003. Dashed lines indicate HIV, dotted lines indicate TB.

