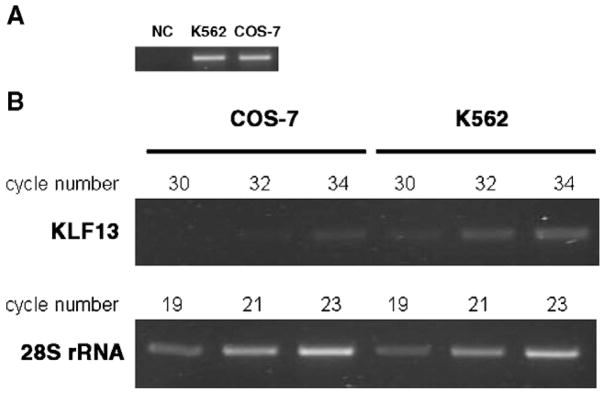
Fig. 2.
Expression of KLF13 mRNAs in COS-7 and K562 cells. (A) PCR using the same amount of genomic DNA. One hundred nanograms of genomic DNA was amplified by 33 cycles of PCR in a 50 μL reaction volume. Subsequently, 10 μL was run on gel. Note that similar bands were generated in COS-7 and K562 cells, indicating comparable efficiencies of amplification between the two cell lines. NC means negative control in which TE buffer instead of DNA was put in the PCR reaction. (B) Semi-quantitative RT-PCR using COS-7 and K562 cell cDNAs. The numbers shown above indicate PCR cycles. Note the similar amplification of 28S rRNA gene between the two cells, and obviously more intense bands on the amplification of KLF13 gene in K562 cells than in COS-7 cells.

