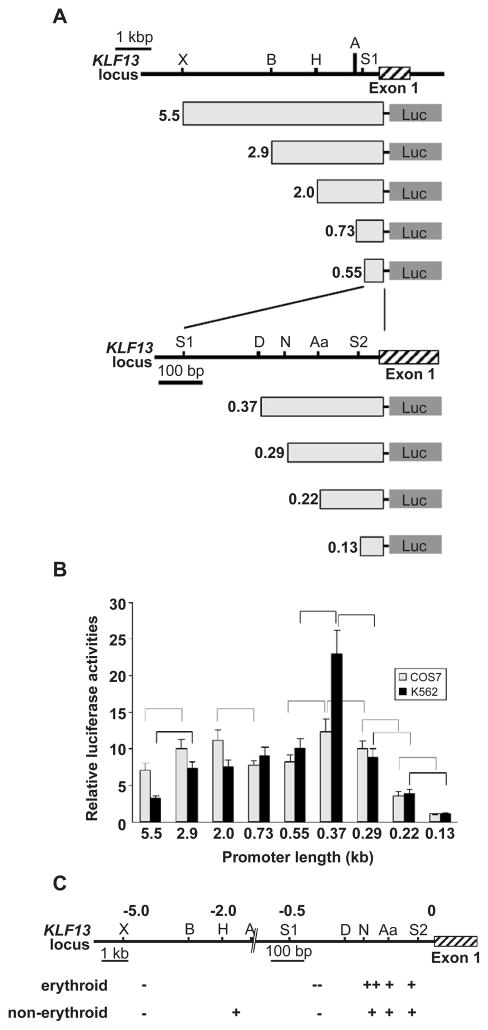
Fig. 3.
Activities of KLF13 gene promoter in erythroid and non-erythroid cells. (A) Reporter constructs and KLF13 locus. Luciferase gene is driven by truncated promoters indicated by light gray rectangles. Restriction sites used for the truncation are indicated above. Abbreviations for restriction sites are X, XbaI; B, BamHI; H, HindIII; A, ApaI; S1, SacI; D, DraIII; N, NaeI; Aa, AatII; and S2, SacII. The length of the promoters is shown at left in kb. (B) Relative luciferase activities obtained from COS-7 (gray bars) and K562 (black bars) cells are shown. Luciferase counts were corrected by the β-Gal activity, and the average count obtained from the 0.13 kb promoter was considered as 1. Error bars indicate one S.D. Results were obtained from three independent transfections in triplicate. Promoter pairs showing significantly different activities are indicated by broken (COS-7) and solid (K562) lines. (C) Positive (+) and negative (−) regulatory regions of KLF13 gene promoter. KLF13 locus is shown above and numbers are the distance to the transcription start site in kb. Note that the scale is altered at −0.7 kb position. Regions having a potent effect are indicated by ++ and −−.

