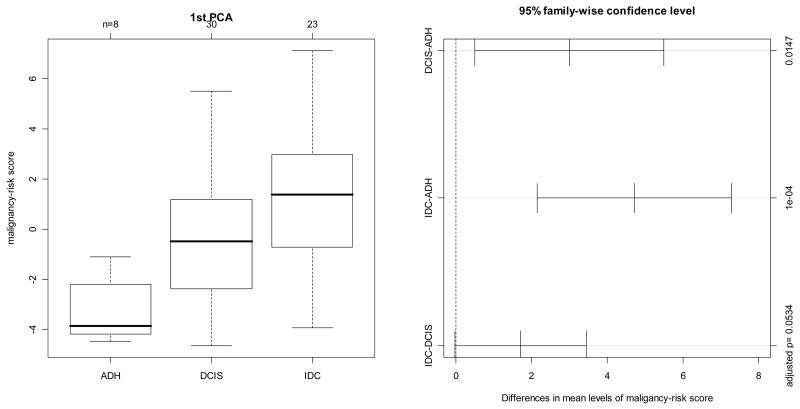
Figure 3. Cancer progression in Ma et al’s study by comparison of the malignancy-risk score among AHD, DCIS, and IDC.
The first panel displayed distribution of the malignancy-risk score among the three groups: ADH, DCIS, and IDC. The 2nd panel was 95% confidence interval of pair-wise comparison for the risk score among the three groups with adjusted p value in the right-hand side’s y axis.

