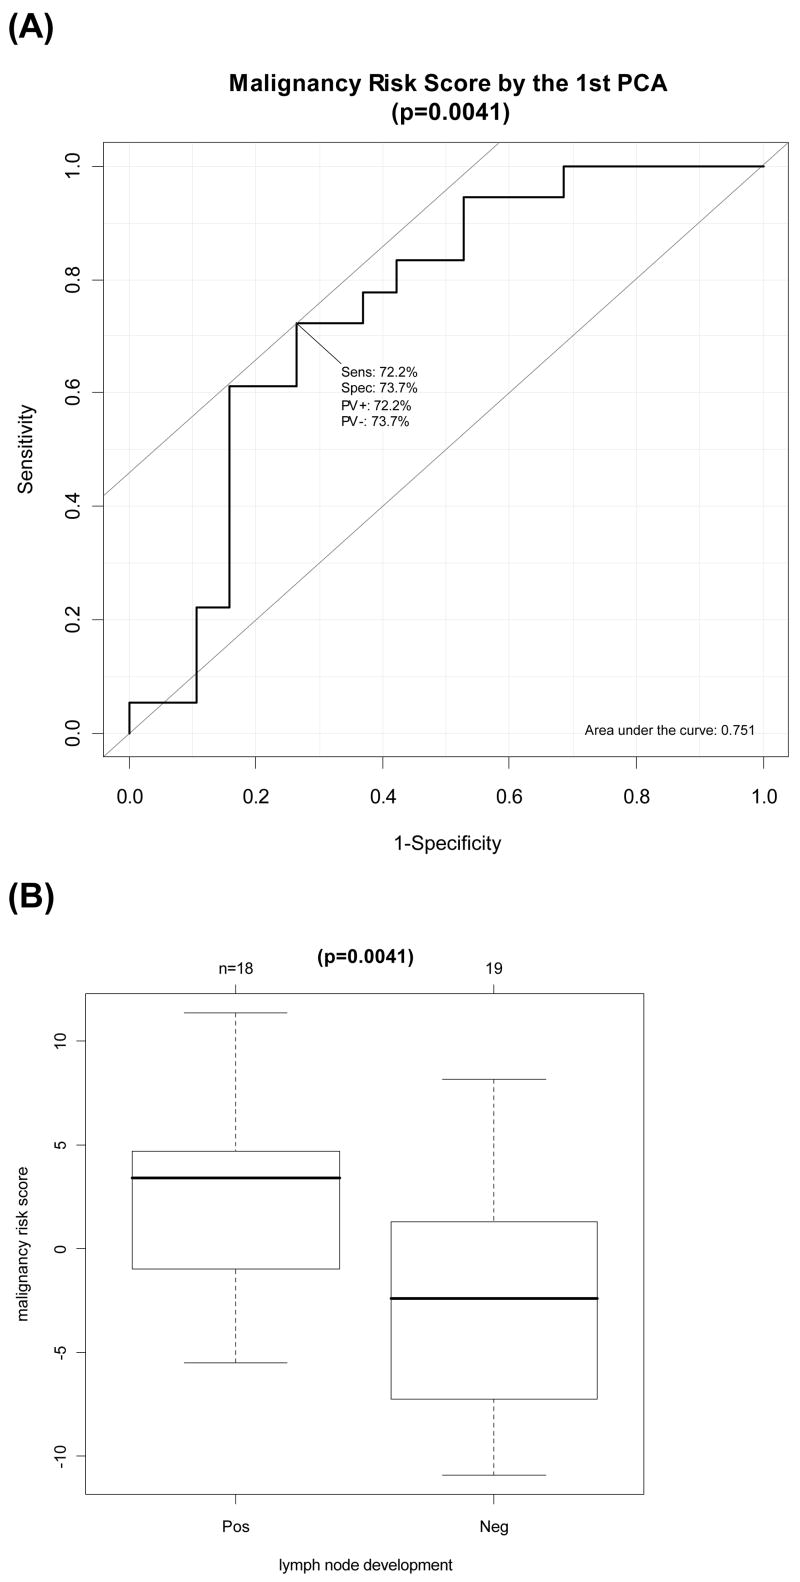
Figure 6. Evaluation of the malignancy-risk gene signature for breast lymph node development in Huang’s breast study.

(A) Area Under Curve (AUC) Calculation for Response Operating Characteristic Curve for the first PCA (p=0.0041). (B) Difference of the malignancy risk score between positive LN versus negative LN (p=0.0041).
