
Figure 4. Tumor growth course during and after GCV treatment in an xenograft tumor model.
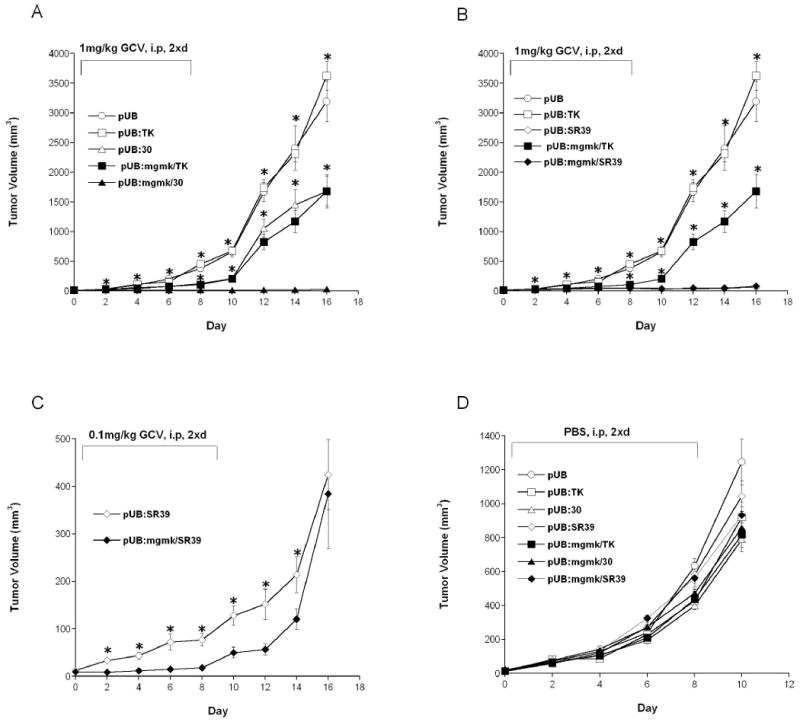
Pools of rat C6 glioma cells transfected with (A) pUB (○), pUB:HSVTK (□), pUB:mgmk/HSVTK (■), pUB:30 (∆) and pUB:mgmk/30 (▲); or (B) pUB (○), pUB:HSVTK (□), pUB:mgmk/HSVTK (■), pUB:SR39 (◇) and pUB:mgmk/SR39 (◆); or (C) pUB:SR39 (◇) and pUB:mgmk/SR39 (◆); or (D) pUB (○), pUB:HSVTK (□), pUB:mgmk/HSVTK (■), pUB:30 (∆), pUB:mgmk/30 (▲), pUB:SR39 (◇) and pUB:mgmk/SR39 (◆) were used to seed tumors in nude mice (n=5 for each group). When tumor size reached 3-4mm (day 0), (A & B) GCV (1mg/kg), (C) GCV (0.1mg/kg) or (D) PBS was intraperitoneally administered twice a day for 8 days. During this period, tumor growth was measured every other day. Tumor volume was calculated using the formula 4/3π ((Width × Length × Height)/2), plotted and analyzed for statistical significance using Student's t-test. Asterisks denote statistical significance (P ≤ 0.05) in tumor sizes between: (A) mice harboring MGMK/30-expressing tumor cells and those that received either vector- or HSVTK-, or mutant 30- or MGMK/HSVTK-expressing tumor cells in the presence of 1mg/kg GCV; (B) mice harboring SR39- or MGMK/SR39-expressing cells (no statistical difference between the two) and those that received either vector- or HSVTK- or MGMK/HSVTK-expressing cell in the presence of 1mg/kg GCV; (C) mice harboring SR39 and those that received MGMK/SR39-expressing cells in the presence of 0.1mg/kg GCV.