
Figure 4. Assessing disruption of endogenous Abl signaling.
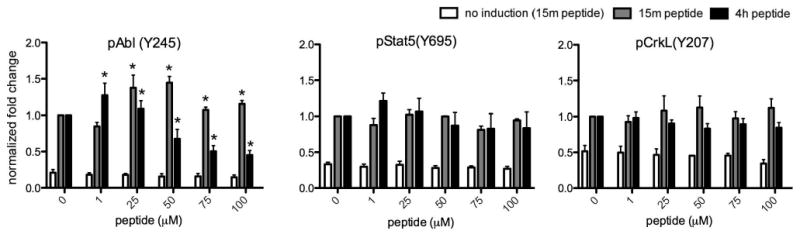
The cells were treated as described in Fig. 3. Lysates were analyzed using SDS PAGE and Western blot (200 μg protein per lane) for pAbl(Y245), pStat5(Y695), pCrkL(Y207) (endogenous Abl sites) and eIF4 or tubulin (loading control). Data shown (n≥3) for each phosphoprotein come from the same blot and are normalized to loading control and represented as fold change from internal control ([peptide] = 0, treated with doxycycline and AP20187 as described in Experimental Methods). *Indicates significant differences from control (p<0.01). See supporting information for representative images of Western blots for these data.