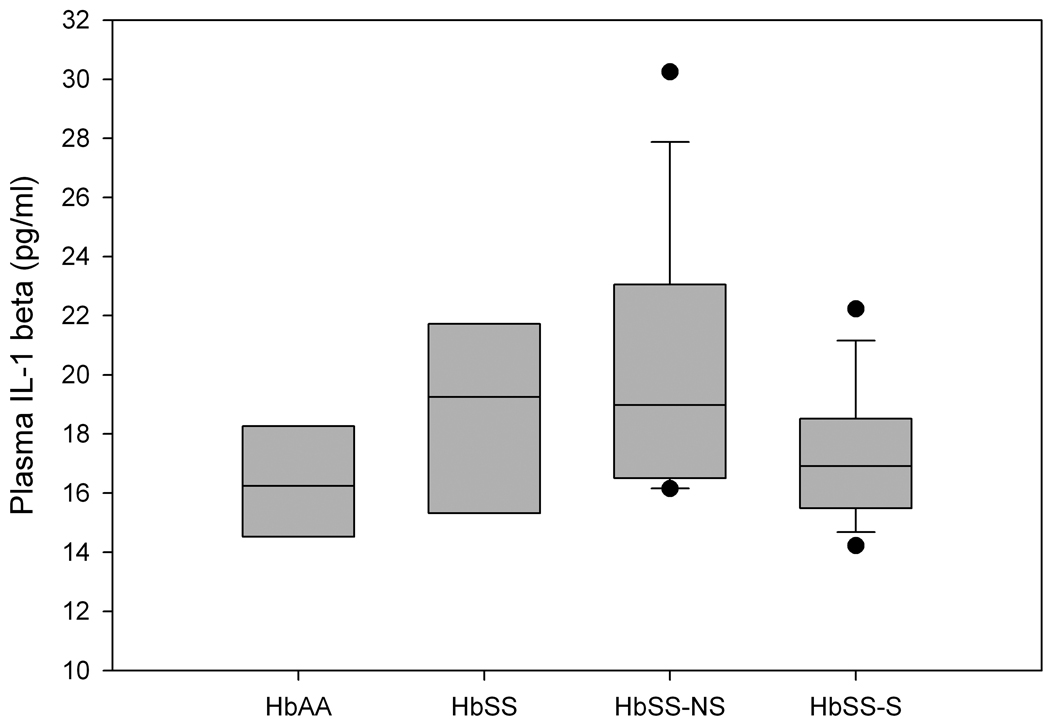
Figure 1.
Comparison of circulating IL-1β for HbAA controls, HbSS steady-state controls, HbSS-NS STOP study subjects with no stroke and HbSS-S STOP study subjects who developed stroke. Values are median plus 25th and 75th percentiles, bars represent 10th and 90th percentiles and points represent values outside of the 10th and 90th percentiles. Using Dunn’s Method for pair-wise comparison there was no statistically significant difference in the median concentration of IL-1β between the groups.

