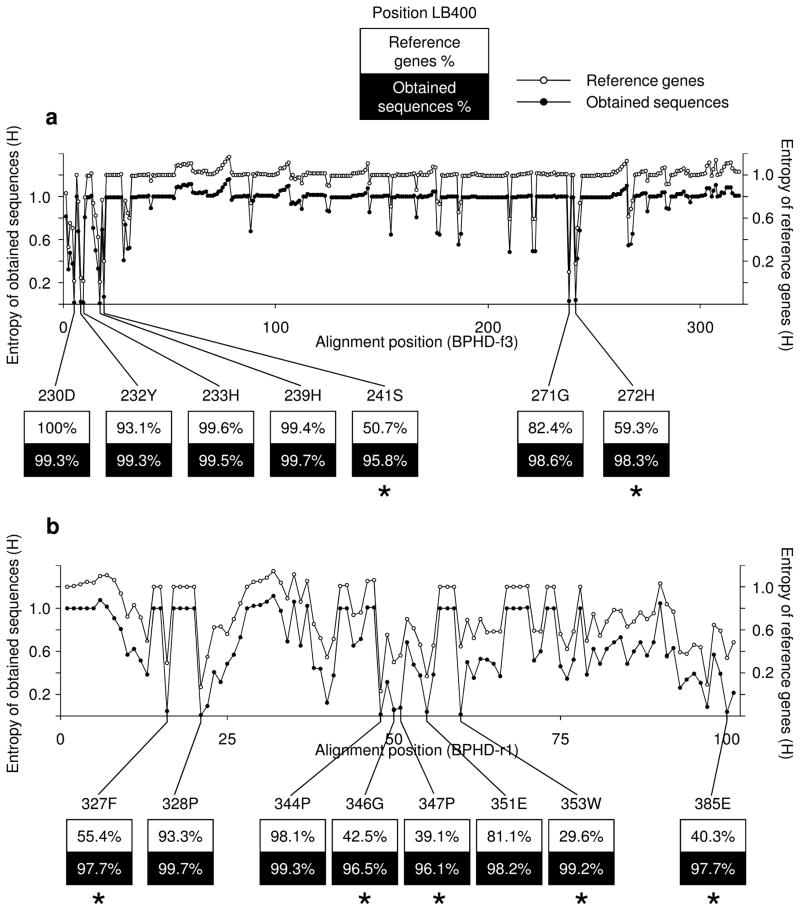
Figure 1.
Shannon entropy (H′) at each alignment position and conserved residues among obtained sequences and/or reference sequences for (a) BPHD-f3 sequences and (b) BPHD-r1 sequences. Open circles (○) indicate entropy of reference sequences and filled circles (●) indicate entropy of obtained sequences. The corresponding position numbers and the residues of bphA1 from B. xenovorans LB400 are indicated. The ratio of residues conserved in either set with >95% are shown. The residues highly conserved only among obtained sequences are indicated with [*].

