
Figure 3. Intragraft cytokine expression and immune cell infiltration.
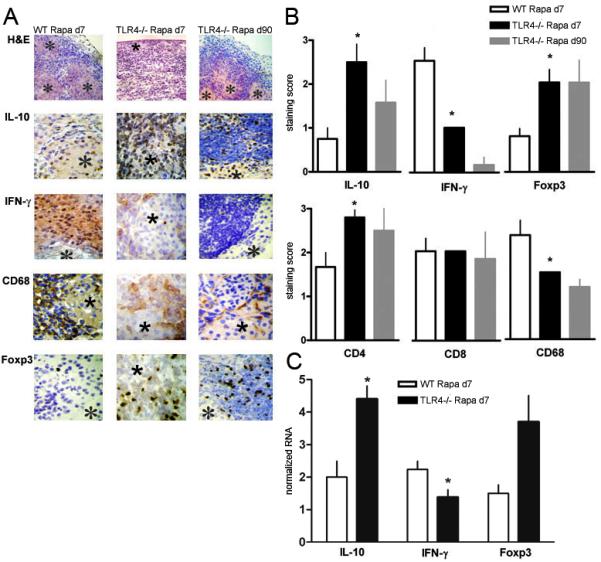
(A) Functioning grafts were harvested on day 7 and day 90 post-transplant and analyzed by H&E, immunohistochemistry for IL-10, IFN-γ, CD68, Foxp3, CD4 and CD8; *indicates an islet; original magnification, ×200 (H&E) and ×400 (IHC). (B) Score of staining of grafts in WT and TLR4−/−B6 recipients (n=3 mice in each group). *p<0.05 compared to wild-type day 7. (C) Functioning grafts were harvested on day 7 and analyzed by qRT-PCR for IL-10, IFN-γ, and Foxp3 (n=3-4). *p<0.05.