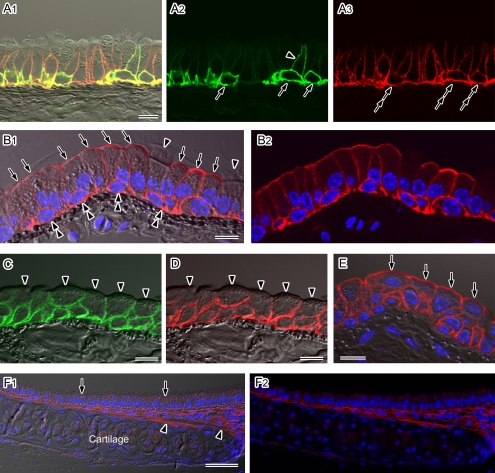
Fig. 2.
Localization of AQP1, AQP3, AQP4, and AQP5 in the mouse trachea. Cryostat sections (A–D) or paraffin sections (E and F) were analyzed by immunofluorescence microscopy after antigen retrieval. Nuclear DNA was counterstained with DAPI (blue in B, E, and F). A–E: Higher magnification views observed under a laser confocal microscope. Fluorescence images merged with (A1, B1, C, D, and E) or without (A2, A3, and B2) the corresponding Nomarski images are shown. A: Double-labeling for AQP3 (green) and AQP4 (red) in the pseudostratified columnar epithelium. Strong AQP3 staining is evident at the cell membranes of basal cells (arrows). A sub-population of the non-ciliated columnar cells is AQP3-positive on their basolateral membranes (arrowhead). AQP4 expression is evident in all basal (double-arrows) and columnar cells. In the columnar cells, AQP4 staining is restricted to the basolateral membranes. B: AQP5 staining (red) in the pseudostratified columnar epithelium. Strong signals are localized to the apical membranes of non-ciliated columnar cells (arrows). The basolateral membranes of the non-ciliated cells and cell membranes of the basal cells (double-arrowheads) are also AQP5-positive. No AQP5 signals are evident in ciliated columnar cells (arrowheads). C–E: The stratified cuboidal epithelium of the trachea was immunostained for AQP3 (green in C), AQP4 (red in D), and AQP5 (red in E). AQP3 and AQP4 signals are evident in all layers except for the luminal membranes of the surface cells (arrowheads). AQP5 is also expressed in all layers including the luminal membranes of non-ciliated surface cells (arrows). F: AQP1 staining (red) observed under low magnification with a conventional fluorescence microscope. Fluorescence images merged with (F1) or without (F2) a corresponding Nomarski image are shown. AQP1 staining is evident in the subepithelial connective tissues including the perichondrium (arrowheads). No signals for this isoform are found in the epithelium (arrows). Bars=50 µm (A), 10 µm (B–F).

