
Fig. 2.
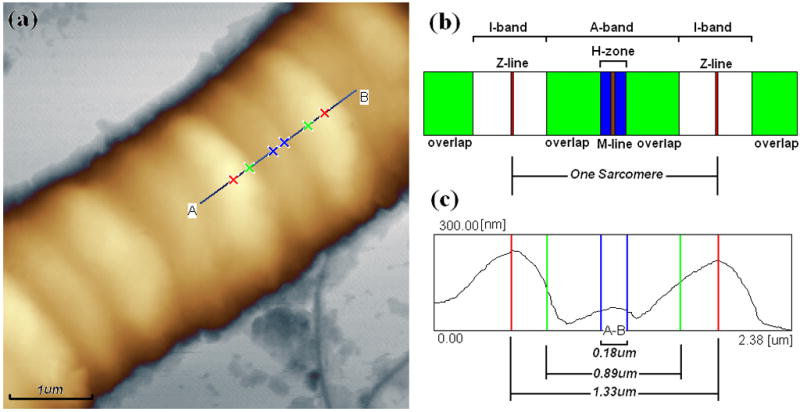
Ultrastructure of single muscle fiber. (a) AFM topography (height) image of bovine cardiac muscle fibers in relaxing state with the section analysis line AB and markers draw on it, image was used for analysis after a second order Flatten, local filtering, and noisy line erasing.; (b) Illustration of ultrastructure in one sarcomere including I-band, A-band, H-zone, Z-line, and M-line, which derived from TEM image of muscle fiber section; (c) Section analysis profile of cardiac muscle fiber in one sarcomere from the line AB draw on (a). The length ratio of I-band and A-band is about 1:2, and H-zone is about 0.18μm long. Image in 512×512 pixels was taken in tapping mode AFM in the air at room temperature at 1Hz.