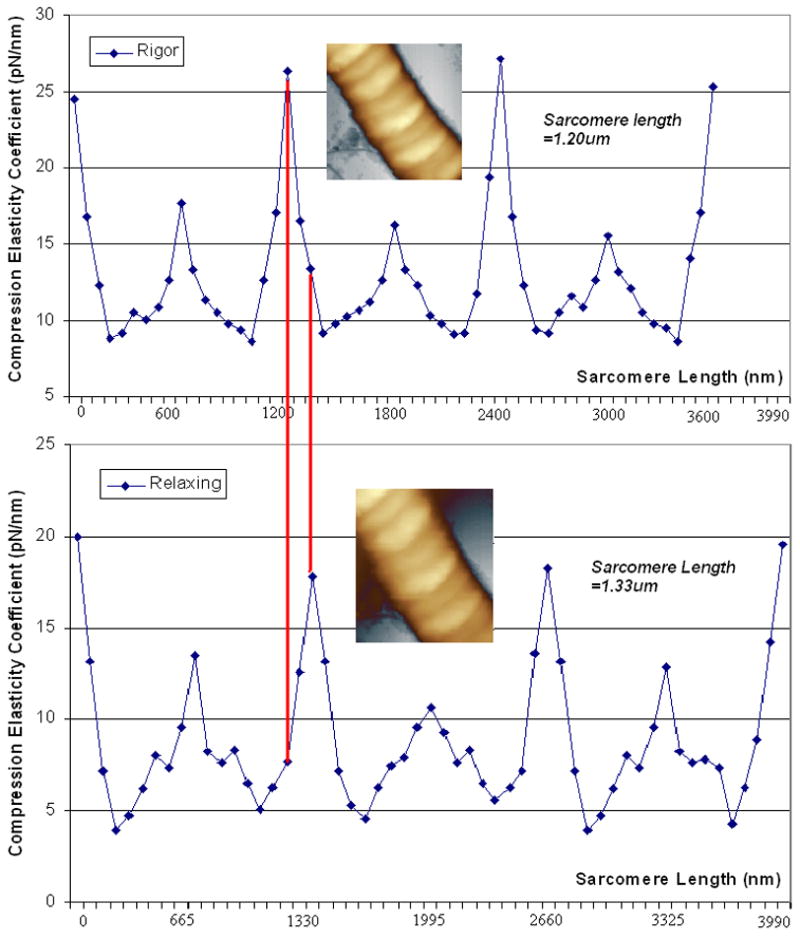
Fig. 5.

Distributions of compression elasticity coefficient along cardiac muscle fiber in rigor (upper curve) and relaxing state (lower curve) compared at same fiber length (4μm) in 55 counts. Sarcomere length in rigor and relaxing states were 1.20μm and 1.33μm respectively. Inset: AFM height images of muscle fibers in rigor (upper) and relaxing state (lower), image size, 5μm×5μm. The data was calculated using the results from ~100μm indentation.
