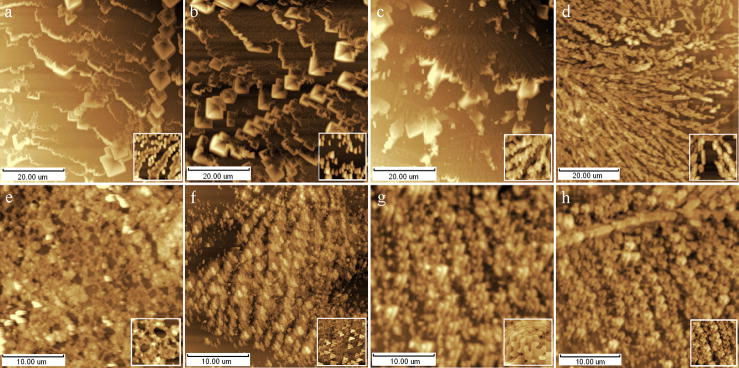
Fig. 1.
AFM height images of common buffers crystals on fresh cleaved mica or clean glass cover. (a) 0.9% NaCl solution, (b) 0.125M KCl solution, (c) PBS-phosphate buffer solution (pH6.8), (d) PBS+Polysaccharides, (e) KCl+mitochondria sap, (f) PBS+ Glutaraldehyde+SW180 cell sap, (g) PBS+Glutaraldehyde+K562 cell sap, (h) 0.25M Sucrose-0.005M Tris-0.001M EDTA+SW180 cell sap. Inset: local microstructure of concerned images in 1×1μm.

