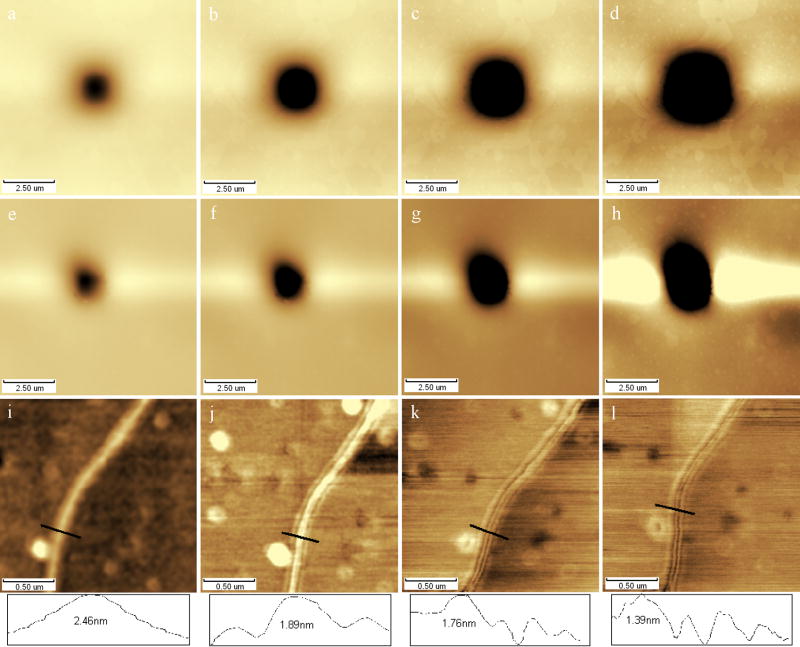
Fig. 4.
AFM height images of samples determined in different scanning time. (a~d) Phosphatidylcholine monolayer was scanned continually in the center area(2.5×2.5μm) for 5, 10, 20 and 40min respectively, (e~h) Erythrocyte was scanned continually in the center area(2.5×2.5μm) for 5, 15, 30 and 60min respectively, (i~l) DNA strands were scanned continually for 5, 15, 30 and 60min respectively. All images were collected in the same force set point.

