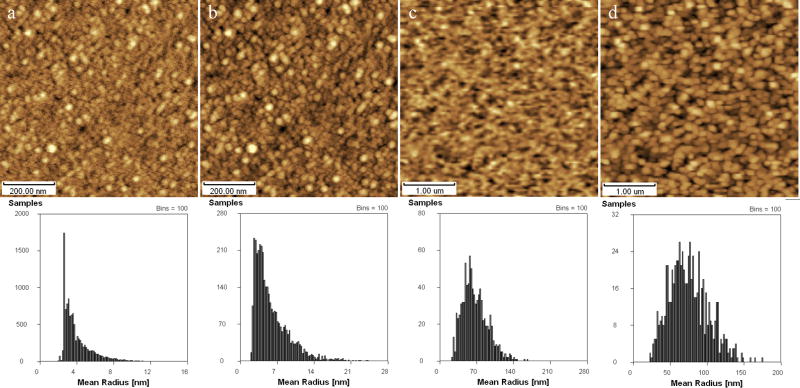
Fig. 6.
AFM height images treated with “minimum” and “maximum” and particle analysis of these images. (a&b) Height images of erythrocyte; (c&d) Height images of phosphatidylcholine film; (a) and (c) were the original images just treated with “X/Y flatten” one time, (b) and (d) were treated with “minimum” and “maximum” based on image (a) and (c) respectively.

