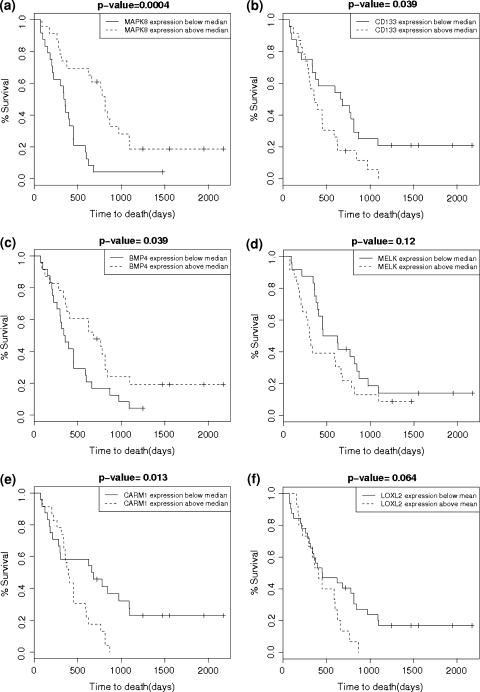
Fig. 5.
Kaplan–Meier curves for selected genes: a MAPK8, b CD133, c BMP-4, d MELK, e CARM1 and f LOXL2. For all graphs the dashed line indicates survival data for patients with greater than median gene expression levels, and the solid line is for patients with less than median gene expression levels. Note that increased levels of MAPK and BMP-4 expression are associated with longer survival, whereas increased CD133 and MELK expression levels correlate with shorter survival. Increased CARM1 and LOXL2 (enriched in SVZ-contacting tumors) also are correlated with poorer survival

