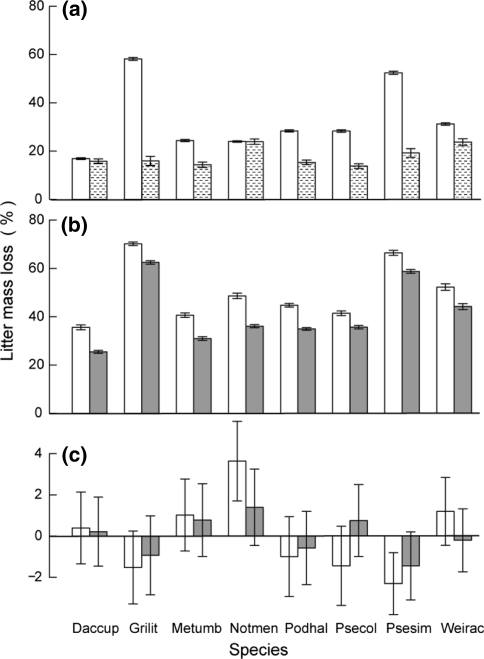
Fig. 2.
Average (±1 SEM) percent mass loss of eight species of New Zealand trees a 0–7 months (open bars) and 7–14 months (dotted bars) after the start of the experiment, b for bags placed in alluvial (open bars) versus terrace (filled bars) forests (after 14 months of decomposition), and c effects of target species on the rate of decomposition of other species in bag, for alluvial (open bars) and terrace (filled bars) forests (after 14 months of decomposition). See Table 2 for abbreviations of the species names

