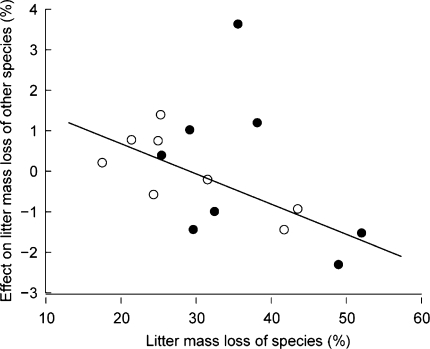
Fig. 3.
Relationship between the % litter loss in the period 0–14 months of incubation for eight New Zealand tree species, and the influence that the species has on the decomposition of other species when placed in a mixture with them (filled circles denote alluvial sites, r = −0.39, P = 0.33; open circles denote terrace sites, r = −0.73, P = 0.04, with regression line shown; MA regression; Warton et al. 2006)). Positive numbers on the y-axis correspond with accelerated loss rates

