
Fig. 2.
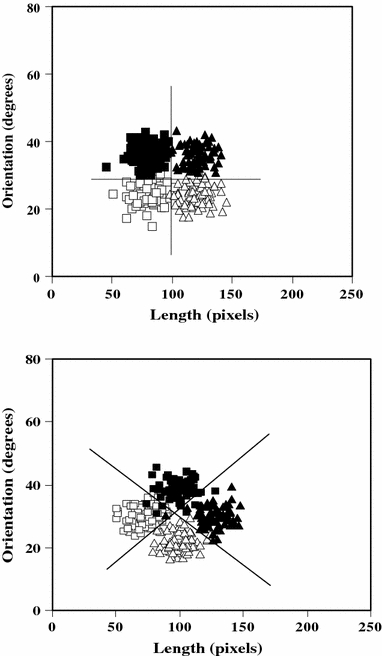
Categorization conditions used for Experiments 1 and 2. The stimuli used in all conditions from Experiment 1 are displayed in the top panel. The stimuli used in all conditions from Experiment 2 are displayed in the bottom panel. Solid lines denote the optimal decision bounds, and the open squares, filled squares, open triangles, and filled triangles denote the stimuli