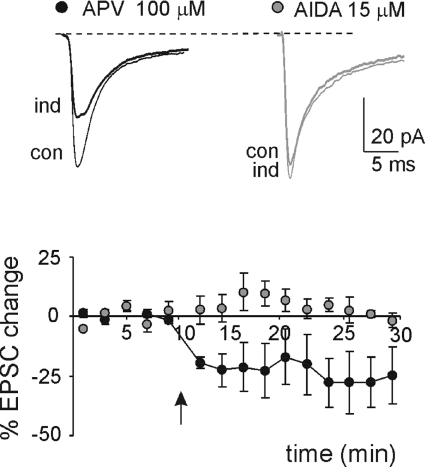
Figure 4. Postsynaptic mGlu receptor-dependent induction of lfs-LTD.
Sample traces of EPSC in control (con) and 15 min after 1 Hz stimulation (ind) in a single cell (average of 100 sweeps) in presence of either 100 μm APV or 15 μm AIDA. The plot shows the time course of average EPSC amplitude changes (APV n= 4, AIDA n= 4). The arrows indicate the induction time and each point is the average of 20 contiguous EPSC amplitudes. Data are reported as mean ±s.e.m.

