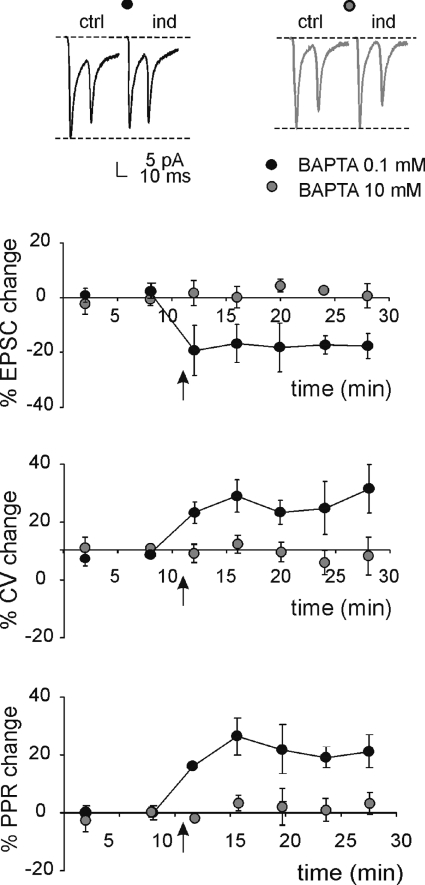
Figure 5. Postsynaptic Ca2+-dependent induction but presynaptic expression of lfs-LTD.
Sample traces of EPSC pairs in control (ctrl) and 15 min after 1 Hz stimulation (ind) in a single cell (average of 100 sweeps) either with 0.1 or 10 mm BAPTA in the intracellular solution.The reference lines indicate control EPSC amplitude. The plots show average changes in EPSC amplitude, CV and PPR after induction using either control (n= 6) or 10 mm BAPTA-containing intracellular solution (n= 4). The arrows indicate the induction time and each point is the average of 20 contiguous EPSC measurements. Data are reported as mean ±s.e.m.

