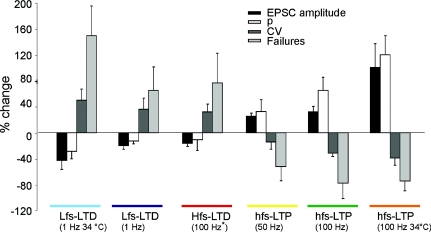
Figure 9. Summary of neurotransmission changes during LTD and LTP expression.
The plot compares EPSC amplitude, CV and failure rate, and release probability (p) changes following different induction protocols comprising 1, 50 and 100 Hz trains with 100 impulses (same as in Fig. 8) as well as 100 Hz trains with 10 impulses. The hfs-LTD data are taken from Gall et al. (2005). Note that all the hfs-LTP (> 50 Hz) patterns are similar, as well as the lfs-LTD and hfs-LTD patterns of expression.

