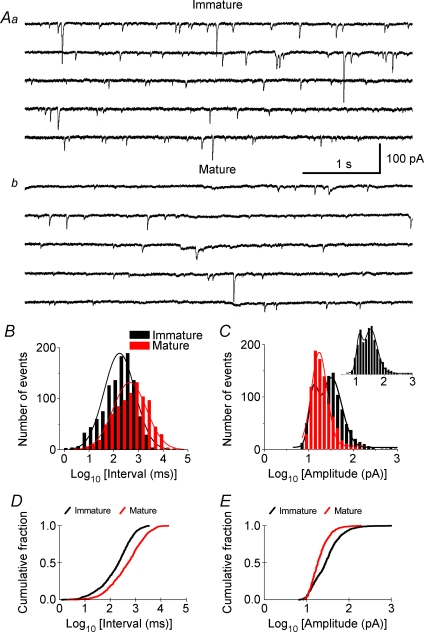
Figure 2. Spontaneous excitatory postsynaptic currents (sEPSCs) in CA3 pyramidal neurons from immature and mature rats.
A, representative sEPSCs recorded in CA3 neurons from immature (14 d, Aa) and adult (93 d, Ab) rats. Five consecutive traces (i.e. 5 s each) from continuous recordings of sEPSCs are shown in each panel. The sEPSCs in slices from immature rat (Aa) were more frequent and of larger amplitude than the sEPSCs recorded in adult slices (Ab). B, combined histograms showing the distribution of sEPSC intervals (milliseconds in log value, bin = 0.2) for the immature (black) and adult (red) groups. More sEPSCs in the immature group had short inter-event intervals (i.e. left side of histogram), and the peak of the histogram was shifted to the left (i.e. shorter interval) compared to that in the adult group. C, histograms showing the logarithmic distribution of sEPSC amplitudes for the immature (black) and adult (red) groups. The histogram of the immature group appeared to fit a two-peak distribution (inset), and the second peak (i.e. larger amplitude sEPSCs) was largely absent in the adult group. D and E, Kolmogorov–Smirnov test showing the cumulative probability of sEPSC intervals (D) and sEPSC amplitudes (E) was significantly different between immature (black) and mature (red) groups (P < 0.001). Note that 100 sEPSCs from each cell were pooled for constructing histograms and for calculating cumulative probability, except for a few cells that had fewer than (but close to) 100 sEPSCs. The peaks of histograms were fitted with a Gaussian distribution.

