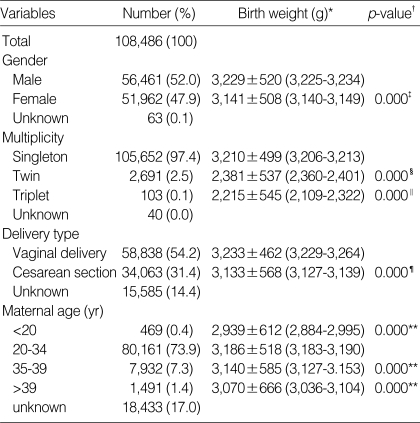
Table 3.
Variables affecting birth weight and mean birth weight according to variables
*: Birth weights were expressed as mean±standard deviation with 95% confidence interval in the parenthesis, †: P values are based on t-test or ANOVA, ‡: versus male, §: versus singleton, ∥: versus singleton or twin, ¶: versus vaginal delivery, **: versus 20-34 yr of maternal age.

