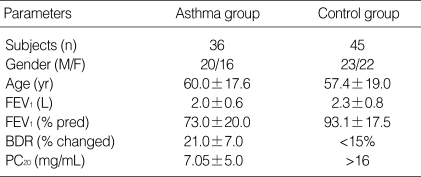
Table 1.
Comparison of demographic characteristics and spirometry of the asthma group and the control group
Data are presented as mean±SD. n, number; M, male; F, female; FEV1, forced expiratory volume in one second; % pred, percent of predicted value; BDR, bronchodilator response; PC20, provocative concentration of methacholine causing FEV1 to fall by 20%.

