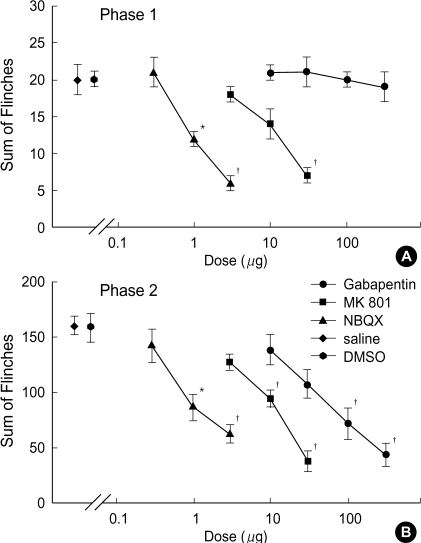
Fig. 2.
Dose response curve of intrathecal gabapentin, MK801 and NBQX for flinching response during phase 1 (A) and phase 2 (B) in the formalin test. Data are presented as the total sum of flinches in each phase. Gabapentin reduces flinches in phase 2 but not in phase 1. MK801 and NBQX produce a dose-dependent inhibition of flinches in both phases. Each line represents the mean±SEM of 6-8 rats. Compared with saline or DMSO, *p<0.01, †p<0.001.

