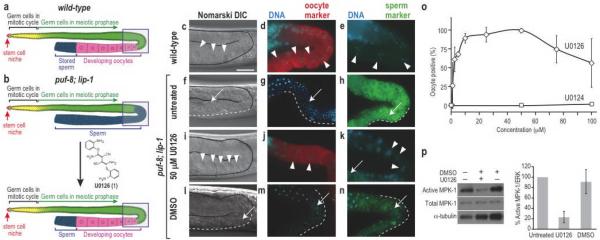
Figure 1. Small-molecule mediated reprogramming of sperm/oocyte fate.
(a) Organization of the wild-type hermaphrodite gonad. Boxed area indicates the region shown in panels. (b) The puf-8; lip-1 gonad produces only sperm, but oocytes can be induced chemically. (c–n) Genotypes and treatments are labelled in the figure. Oocytes are indicated with arrowheads. The extent of sperm is indicated with white dashed lines and representative single sperm with arrows. Scale bar, 10 μm. (c, f, i, l) DIC images reveal morphology of large granular oocytes (c, i) or small condensed sperm (f, l). (d, g, j, m) Germlines stained for DNA using DAPI (blue) and the RME-2 oocyte marker (red). (e, h, k, n) Germlines stained for DNA using DAPI (blue) and the SP56 sperm marker (green). (o) Dose-response analysis for oogenesis induction by U0126 (◊) and its inactive analog U0124 (□). Data are presented as mean +/− s.d., n=3–12 independent experiments with 3–149 (ave. 13) animals each. (p) Left, semi-quantitative Western blot analysis of activated MPK-1/ERK (top panel), total MPK-1/ERK (middle panel), and α-tubulin (bottom panel) in untreated, U0126-treated, and DMSO-treated animals. Right, graph generated with active MPK-1/ERK signals normalized to α-tubulin (n=3) and compared to untreated signal (set as 100% Active MPK-1/ERK).

