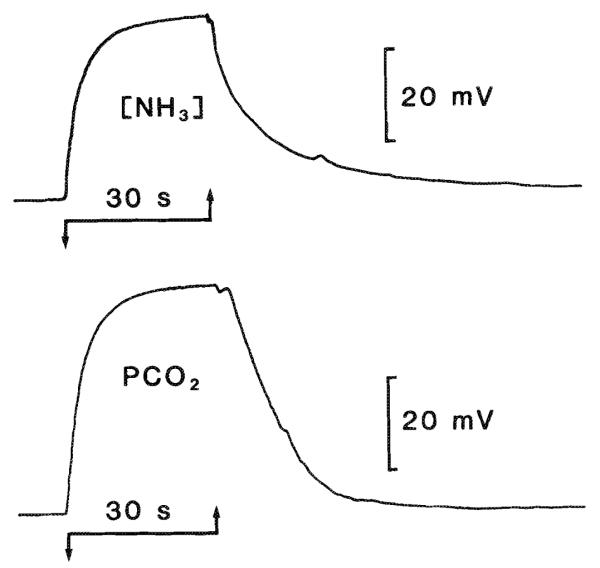
Fig. 1.

Response time of NH3 and CO2 semimicroelectrodes. Electrodes were placed in a loose fitting plastic tube (5 cm long and 0.4 cm internal diameter) connected to one port of a three-way stopcock. The other two ports received humidified gas at different concentrations. In this way, gas streams that passed the active surface of the electrode could be rapidly switched from one concentration to another. For example, the top trace shows the response of an NH3-sensitive electrode to changes in [NH3] created by bubbling nitrogen gas through 10 mM ammonium chloride (downgoing arrow) or 1 M ammonium chloride (upgoing arrow).t95 (the time for the electrode to reach 95% of its final value after a step change in concentration of the measured species) was approximately 10 s. The CO2 electrode t95 (lower trace) was improved from the 30–40 s previously reported (Kraig et al. 1986) to about 5 s by adding 10 mg/mL of carbonic anhydrase (EC 4.2.1.1.; Sigma) to the backfill solution. 5% CO2 – 95% oxygen initially flowed past the CO2 electrode (downgoing arrow) followed by 101% CO2 (upgoing arrow).
