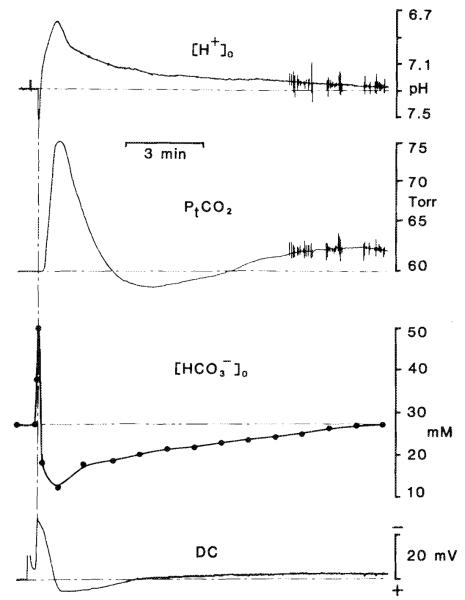
Fig. 3.
Changes in carbonic acid buffer species during spreading depression. The uppermost trace shows [H+]o changes after spreading depression elicited by 100 Hz bipolar surface stimulation for 5 s on the parietal cortex. The [H+]o recording was made 300 μm beneath the parietal–pial surface. In this example, [H+]o reached a peak acid level of pH 6.79 before returning to base line. The DC signal (lowermost trace) was recorded from the reference barrel of the H+-selective double-barrelled microelectrode. The negative DC shift was used as a time mark to gauge the time to [H+]o, PtCO2, or [NH3] peak changes and their resolution. PtCO2 (second trace from the top) was recorded from the adjacent parietal surface. Here PtCO2 rose to 79 Torr before returning to base line in a damped oscillatory fashion. changes (second trace from the bottom) were calculated according to Eq. 4. Solid dots represent specific calculated points. In this example rose to approximately 52 mM during the alkaline transient ( ) and fell to a low of 13 mM before returning to base line.

