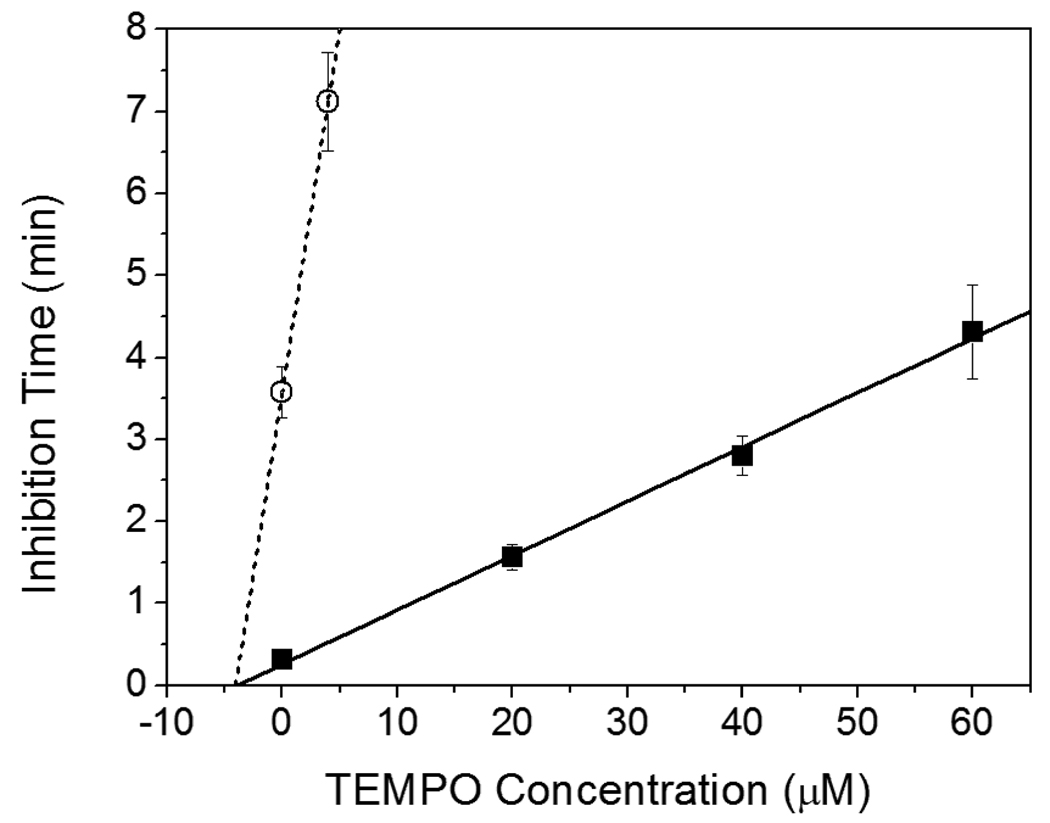
Figure 4.
Adaptation of the data in Figure 3 to show the correlation of inhibition time with TEMPO concentration in both the eosin system (■ and —) and the I2959 system (○ and ····). The inverse slopes of the lines indicate the initiation rate, or the radical generation rate, of each system. The x-intercept is indicative of the inhibitor concentration in the monomer prior to the addition of TEMPO.

