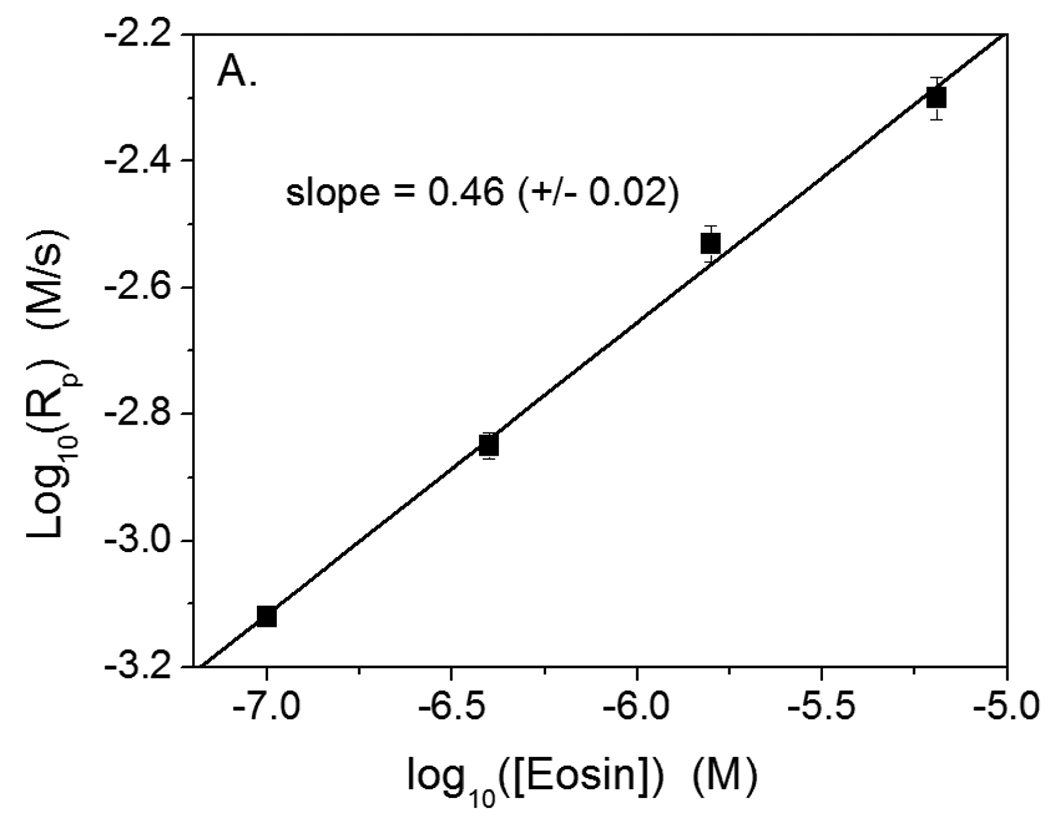
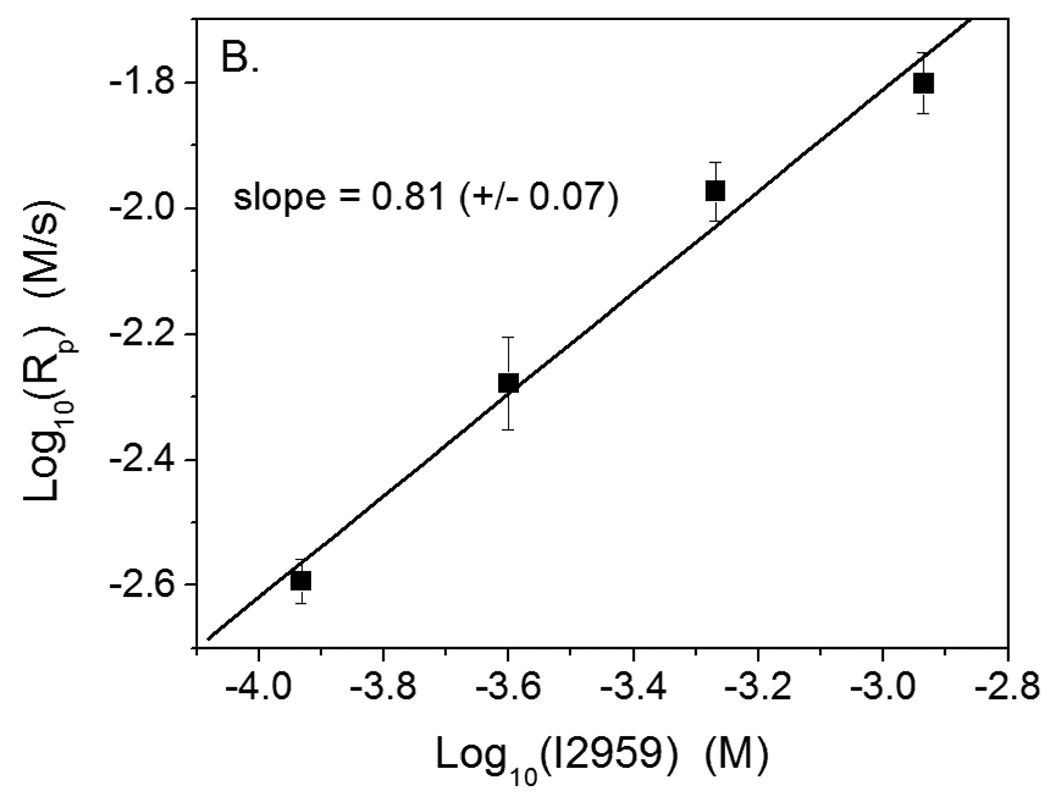
Figure 7.
Plots to calculate the scaling exponent between initiation rate and polymerization rate for polymerization in 420 mM PEGDA, 210 mM MDEA and 35 mM VP in water. A. Polymerization initiated by eosin-ITC with 75 mW/cm2 >480 nm light. B. Polymerization initiated by I2959 with 4.0 mW/cm2, 320–390 nm light. The lines represent linear, least squares fits to the experimental data. The slope of each line is α, which represents the scaling exponent between the polymerization and initiation rates.


